
What is Data Science?
Data Science is the area of study which involves extracting insights from vast amounts of data by the use of various scientific methods, algorithms, and processes. It helps you to discover hidden patterns from the raw data.
The term Data Science has emerged because of the evolution of mathematical statistics, data analysis, and big data.
Data Science is an interdisciplinary field that allows you to extract knowledge from structured or unstructured data. Data science enables you to translate a business problem into a research project and then translate it back into a practical solution.
In this tutorial, you will learn
- What is Data Science?
- Why Data Science?
- Data Science Components
- Data Science Process
- Data Science Jobs Roles
- Tools for DataScience
- Difference between Data Science with BI (Business Intelligence)
- Applications of Data science
- Challenges of Data science Technology
Why Data Science?

Here, are significant advantages of using Data Analytics Technology:
- Data is the oil for today's world. With the right tools, technologies, algorithms, we can use data and convert it into a distinctive business advantage
- Data Science can help you to detect fraud using advanced machine learning algorithms
- It helps you to prevent any significant monetary losses
- Allows to build intelligence ability in machines
- You can perform sentiment analysis to gauge customer brand loyalty
- It enables you to take better and faster decisions
- Helps you to recommend the right product to the right customer to enhance your business

Data Science Components

Statistics:
Statistics is the most critical unit in Data science. It is the method or science of collecting and analyzing numerical data in large quantities to get useful insights.
Visualization:
Visualization technique helps you to access huge amounts
of data in easy to understand and digestible visuals.
Machine Learning:
Machine Learning explores the building and study of algorithms which learn to make predictions about unforeseen/future data.
Deep Learning:
Deep Learning method is new machine learning research where the algorithm selects the analysis model to follow.
Data Science Process

1.Discovery:
Discovery step involves acquiring data from all the identified internal & external sources which helps you to answer the business question.
The data can be:
- Logs from webservers
- Data gathered from social media
- Census datasets
- Data streamed from online sources using APIs
2.Data Preparation:
Data can have lots of inconsistencies like missing value, blank columns, incorrect data format which needs to be cleaned. You need to process, explore, and condition data before modeling. The cleaner your data, the better are your predictions.
3.Model Planning:
In this stage, you need to determine the method and technique to draw the relation between input variables. Planning for a model is performed by using different statistical formulas and visualization tools. SQL analysis services, R, and SAS/access are some of the tools used for this purpose.
4. Model Building:
In this step, the actual model building process starts. Here, Data scientist distributes datasets for training and testing. Techniques like association, classification, and clustering are applied to the training data set. The model once prepared is tested against the "testing" dataset.
5. Operationalize:
In this stage, you deliver the final baselined model with reports, code, and technical documents. Model is deployed into a real-time production environment after thorough testing.
6. Communicate Results
In this stage, the key findings are communicated to all stakeholders. This helps you to decide if the results of the project are a success or a failure based on the inputs from the model.
Data Science Jobs Roles
Most prominent Data Scientist job titles are:
- Data Scientist
- Data Engineer
- Data Analyst
- Statistician
- Data Architect
- Data Admin
- Business Analyst
- Data/Analytics Manager
Let's learn what each role entails in detail:
Data Scientist:
Role:
A Data Scientist is a professional who manages enormous amounts of data to come up with compelling business visions by using various tools, techniques, methodologies, algorithms, etc.
Languages:
R, SAS, Python, SQL, Hive, Matlab, Pig, Spark
Data Engineer:
Role:
The role of data engineer is of working with large amounts of data. He develops, constructs, tests, and maintains architectures like large scale processing system and databases.
Languages:
SQL, Hive, R, SAS, Matlab, Python, Java, Ruby, C + +, and Perl
Data Analyst:
Role:
A data analyst is responsible for mining vast amounts of data. He or she will look for relationships, patterns, trends in data. Later he or she will deliver compelling reporting and visualization for analyzing the data to take the most viable business decisions.
Languages:
R, Python, HTML, JS, C, C+ + , SQL
Statistician:
Role:
The statistician collects, analyses, understand qualitative and quantitative data by using statistical theories and methods.
Languages:
SQL, R, Matlab, Tableau, Python, Perl, Spark, and Hive
Data Administrator:
Role:
Data admin should ensure that the database is accessible to all relevant users. He also makes sure that it is performing correctly and is being kept safe from hacking.
Languages:
Ruby on Rails, SQL, Java, C#, and Python
Business Analyst:
Role:
This professional need to improves business processes. He/she as an intermediary between the business executive team and IT department.
Languages:
SQL, Tableau, Power BI and, Python
Tools for DataScience
| Data Analysis | Data warehousing | Data Visualization | Machine Learning |
| R, Spark, Python and SAS | Hadoop, SQL, Hive | R, Tableau, Raw | Spark, Azure ML studio, Mahout |
Difference between Data Science with BI (Business Intelligence)
| Parameters | Business Intelligence | Data Science |
| Perception | Looking Backward | Looking Forward |
| Data Sources | Structured Data. Mostly SQL, but some time Data Warehouse) | Structured and Unstructured data. Like logs, SQL, NoSQL, or text |
| Approach | Statistics & Visualization | Statistics, Machine Learning, and Graph |
| Emphasis | Past & Present | Analysis & Neuro-linguistic Programming |
| Tools | Pentaho. Microsoft Bl, QlikView, | R, TensorFlow |
Applications of Data science
Internet Search:
Google search use Data science technology to search a specific result within a fraction of a second
Recommendation Systems:
To create a recommendation system. Example, "suggested friends" on Facebook or suggested videos" on YouTube, everything is done with the help of Data Science.
Image & Speech Recognition:
Speech recognizes system like Siri, Google assistant, Alexa runs on the technique of Data science. Moreover, Facebook recognizes your friend when you upload a photo with them, with the help of Data Science.
Gaming world:
EA Sports, Sony, Nintendo, are using Data science technology. This enhances your gaming experience. Games are now developed using Machine Learning technique. It can update itself when you move to higher levels.
Online Price Comparison:
PriceRunner, Junglee, Shopzilla work on the Data science mechanism. Here, data is fetched from the relevant websites using APIs.
Challenges of Data science Technology
- High variety of information & data is required for accurate analysis
- Not adequate data science talent pool available
- Management does not provide financial support for a data science team
- Unavailability of/difficult access to data
- Data Science results not effectively used by business decision makers
- Explaining data science to others is difficult
- Privacy issues
- Lack of significant domain expert
- If an organization is very small, they can't have a Data Science team
Summary
- Data Science is the area of study which involves extracting insights from vast amounts of data by the use of various scientific methods, algorithms, and processes.
- Statistics, Visualization, Deep Learning, Machine Learning, are important Data Science concepts.
- Data Science Process goes through Discovery, Data Preparation, Model Planning, Model Building, Operationalize, Communicate Results.
- Important Data Scientist job roles are: 1) Data Scientist 2) Data Engineer 3) Data Analyst 4) Statistician 5) Data Architect 6) Data Admin 7) Business Analyst 8) Data/Analytics Manager
- R, SQL, Python, SaS, are essential Data science tools
- The predictions of Business Intelligence is looking backward while for Data Science it is looking forward.
- Important applications of Data science are 1) Internet Search 2) Recommendation Systems 3) Image & Speech Recognition 4) Gaming world 5) Online Price Comparison.
- High variety of information & data is the biggest challenge of Data Science technology.
SAS Tutorial for Beginners: What is, Architecture, Example Program
What is SAS?
SAS stands for Statistical Analysis Software which is used for Data Analytics. It helps you to use qualitative techniques and processes which allows you to enhance employee productivity and business profits. SAS is pronounced as SaaS.
In SAS, data is extracted & categorized which helps you to identify and analyze data patterns. It is a software suite which allows you to perform advanced analysis, Business Intelligence, Predictive Analysis, data management to operate effectively in the competitive & changing business conditions. Moreover, SAS is platform independent which means you can run SAS on any operating system either Linux or Windows.
Compared to other BI tools, SAS provides extensive support to programmatically transform and analyze data, apart from using the drag and drop interface. This provides very granular control over data manipulation and analyzes which is its USP.
In this tutorial, you will learn
- What is SAS?
- Why do we need SAS?
- Alternative SAS Tools
- SAS history
- SAS Features
- SAS Product Suite
- SAS Architecture
- How to Download and Install SAS
- How to Use SAS?
- SAS Program Example
- The complete SAS Program
- Where is SAS used?
- SAS Vs. R
- Advantages of SAS
- Disadvantages of SAS
Why do we need SAS?
Let's understand the need for SAS with a simple example:
Consider an e-commerce company that wants to know the buying patterns of its customers based on historical data. The company will have to consider thousands of records of multiple customers, to get the generalize insight.
The company may not have all these data required for the analysis. For example, if a customer did not buy a Jacket, then what are the factors which stopped them not buy the Jacket? This missing data could create errors in your analysis. How can you we get rid of these problems? How can we handle this type of data?
If done manually, this task will require hundreds of analysts and thousands of man-hours. By using SAS analytic tool, you can do the same analysis in a matter of hours with a single analyst. SAS allows you to eliminate unnecessary data and optimize the relevant information. It will enable you to predict an outcome even with missing data. SAS enables you to take better decisions.
Alternative SAS Tools

R: It is open-source software. It is easy to learn R as it is well documented. It offers strong statistical capabilities.
Python is another popular open-source scripting language. It is supports libraries such as Numpy, Scipy, and MatPlotLib. You can perform any statistical operation, or you can build any model using these libraries.
SAS: It is the widely used analytical tool in the commercial analytics market. With a plethora of statistical functions and good GUI.
In this tutorial, we will discuss the SAS Tutorial, and how it can be used to solve our problems.
SAS history
- SAS was developed by Jim Goodnight and John Shall in 1970 at N.C. University
- Initially, it was developed for Agricultural Research.
- Later, it expanded to a gamut of tools to include Predictive Analytics, Data Management, BI among others.
- Today 98 of world's top companies in fortune 400 uses SAS data analytical tool for Data analysis.
SAS Features
Key features of SAS are:
- Easily access raw data files & data in from an external database. Read and write almost any data format!
- Manage data using tools for data entry, editing retrieval, formatting & conversion
- Analyze data using descriptive, statistics, multivariate techniques, forecasting, modeling, linear programming
- Advanced analytics helps you to make changes and improvements in business practices.
- Report formation with perfect graphs
- Operations research and project Management
- Data updating and modification
- Powerful data handling language
- Excellent data cleansing functions
- Interact with multiple host systems
SAS Product Suite
There are many SAS products is available in the market. Following is a list of the more popular ones.
| Name | Description |
| Base SAS | Base SAS software offers hardware agility and integrates into all kind of computing environment. |
| SAS/GRAPH | This tool helps you to represent structured data into graphs. |
| SAS/STAT | This tool helps you to perform different types of regression, statistical analysis variance, regression, and psychometric analysis. |
| SAS/ETS | It is used for forecasting. Helps you to perform the time series analysis. |
| SAS/IML | Interactive Matric language is known as IML. This tool helps you to translate mathematical formulas into an innovative program. |
| SAS EBI | A tool for Business Intelligence Applications |
| SAS Grid Manager | It is a core component which offers data management facility and a programming language for data analysis |
| SAS/OR | Tool for Operation research |
| SAS/QC | Use for Quality control |
| SAS/Enterprise Miner | Data mining |
| SAS/PH | Clinical trial analysis |
| SAS/AF | It offers applications facility |
| Enterprise Guide | It is a GUI based code editor & project manager |
SAS Architecture

SAS architecture is divided mainly of three parts:
- Client Tier
- Middle Tier
- Back tier
Client tier:
Client tier is where the application is installed on a machine, where the user is sitting. It consists of the components which are used to view the portal and its content. It also includes a standard web browser that is used to interact with the portal over standard HTTP or HTTPS protocol. It also helps you to make the SAS web application firewall friendly.
Middle tier:
The middle tier offers a centralized access point for enterprise information. All access to content is processed by components operating of this tier. The separation of the business logic with display logic helps you to leverage the logic of the middle tier. Moreover, centralized points of access make it easier to enforce security rules, administer the portal and manage code changes.
The middle tier hosts the following functions:
SAS Information Delivery Portal Web Application: It is the collection of JSP, Java servlets, JavaBeans, and other classes and resources. These components help you to access information stored in the enterprise directory to create a customizable interface for the user.
Servlet Engine: The servlet engine is also called a servlet container. It is responsible for managing the SAS Information Delivery Portal Web Application. The servlet engine offers a run time environment. It provides concurrency, deployment, lifecycle management, etc.
Web server: Web server offers service for the servlet engine which can be used to host website. This should be accessed using the portal.
Back Tier:
The back tier is an area where the data and computation servers run which may contain business objects. It is an enterprise directory server. The enterprise directory server maintains metadata about content which is located throughout the enterprise.
How to Download and Install SAS
Local Download in your machine
Step 1) Go to this link https://www.sas.com/en_in/software/university-edition.html and click on Get Free Software.

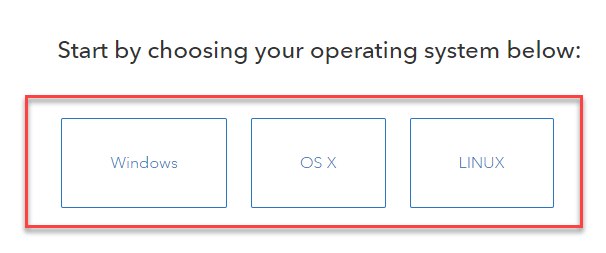
Step 2) Select your Operating System.
Step 3) SAS requires Virtualization Software like VirtualBox to be installed before it can be installed. Here are the detailed steps

Follow the steps mentioned onscreen to install SAS. Having VirtualBox and local install could sometime be tricky. We recommend AWS installation-
AWS Installation
You can deploy SAS in AWS. It's eligible for free tier.
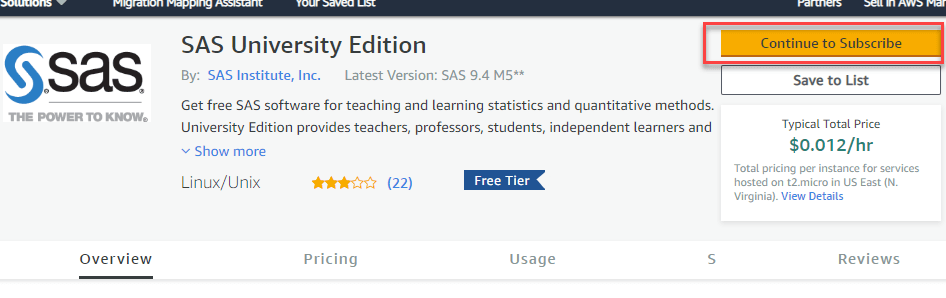
Step 1) Go to https://aws.amazon.com/marketplace/pp/B00WH30IKW. Click "Continue to Subscribe"
Step 2) In this next screen, Accept Terms.
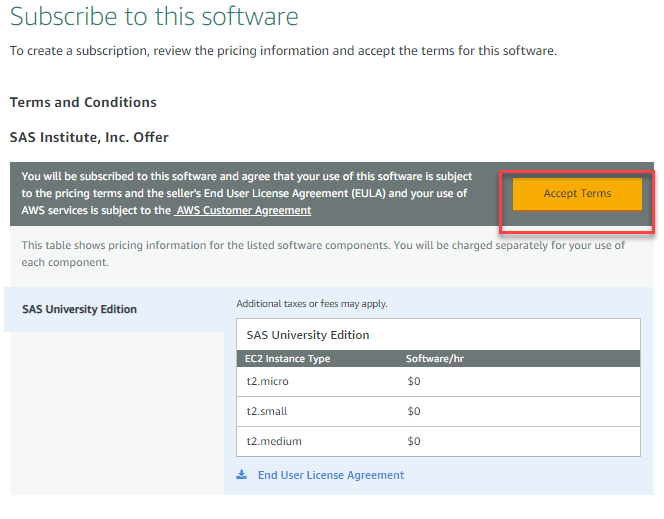
Step 3) The subscription is pending takes up to 10 minutes to approve. You will see the following screen.

Step 4) Refresh the page, and you will subscription confirmed. Click on Continue to Configuration

Step 5) Keep settings default and click Continue to Launch.

Step 6) Review the config page. Enter a key-value pair. Rest settings should be the default. Click Launch

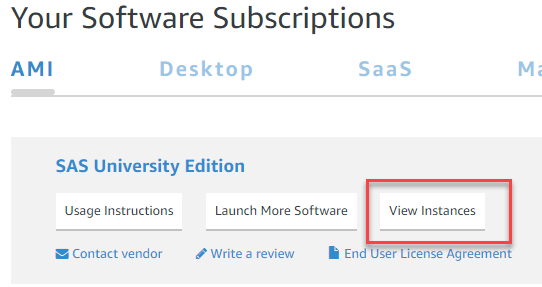
Step 7) Go to https://aws.amazon.com/marketplace/library/ and click on View Instances.
Step 8) In the popup
- Note the instance id. This is your password
- Click Access software
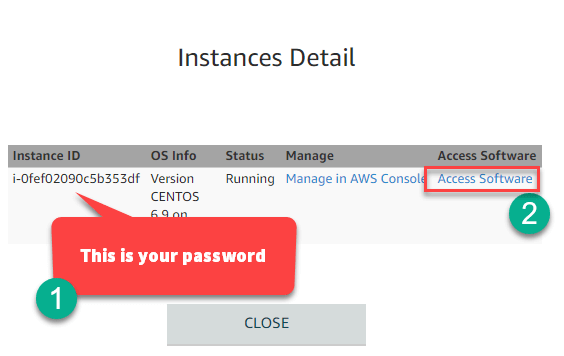
Step 9) In the popup, that appears after you click in step 8
- Enter user credentials. Id: sasdemo password: instance id noted in step 8
- Click Sign in

Step 10) You will see the welcome screen.

Troubleshooting
If you are not able to connect, go to https://console.aws.amazon.com/ec2/v2/home?region=us-east-1#SecurityGroups:sort=groupId and inbound/outbound rules to all
How to Use SAS?
To effectively use SAS software you need to follow four steps which are: Access Data, Management Data, Analyze, Present

Access Data:
SAS allows you to access data in any desired format that you want.
You can access data that is stored anywhere, whether it is in a file on your system or data that is stored in another database system. It can be oracle file, SAS database file, Raw Database file or a simple XLS /CSV file. It will help you to access this data with ease.
Manage Data:
SAS offers great data management capabilities. You can subset/slice data based on certain conditions, create variable, clean & validate data. There are other tools which allow you to perform the same task. However, SAS helps you to perform this job with ease.
SAS has well-defined libraries and processes which makes the programming process easy. Moreover, creating variable or subset data is just one step process. This saves you from writing complex algorithms by just a single line of code.
Analyze:
You can do various kinds of analyze using SAS:
- It checks Frequency of Mean calculation
- Regression and Forecasting
- Decision Tree
All these analyzes can easily handle by SAS. It is the best tool for accurate forecasting.
Present:
If you visualize data correctly, it is effortless for the audience to relate to it. It is essential that your tool present the data in a suitable manner. That's what SAS does for you. It has excellent presentation capabilities.
You can:
1. List reports
2. Summary reports
3. Graph reports
4. Print reports
SAS Program Example
SAS Program consists of three necessary steps:
- Data Step
- Proc Step
- Output Step
DATA Step:
Data step loads the needed data set into SAS memory and finds the correct variables of the data set. It also captures the records. We can use data steps to:
- Enter data into SAS data sets
- Compute Values
- Check or correct data
- Produce new data sets
The syntax for DATA statement is:
Syntax
DATA data_set_name;  #Give a name to the dataset
INPUT var1,var2,var3;   #Declare variables in the dataset.
NEW_VAR;            #Define new variables.
LABEL;          #Give variables a label
DATALINES;         #Provide data
RUN;
Example:
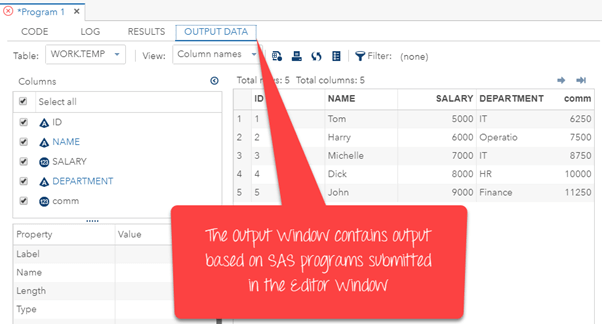
Following example show how to define a variable, naming the data set, creating new variables and entering the data. In this example, you can see that string variable have a $ at the end, and numeric values are without it.
INPUT ID $ NAME $ SALARY DEPARTMENT $;
comm = SALARY*1.50;
LABEL ID = 'Emp_ID' comm = 'COMMISION';
DATALINES;
1 Tom 5000 IT
2 Harry 6000 Operations
3 Michelle 7000 IT
4 Dick 8000 HR
5 John 9000 Finance
;
RUN;
Note: To execute SAS Statement need to specify the RUN command.
PROC Step
It performs specific analysis or functions to produce results and reports.
Syntax
PROC procedure_name options; #The name of the proc.
RUN;
Example
The given example uses the MEANS procedure to print the mean values of the numeric variables in the data set.
PROC MEANS;
RUN;
The OUTPUT Step
You can display the data from the data with conditional output statements.
Syntax
PROC PRINT DATA = data_set;
OPTIONS;
RUN;
Every SAS program must follow all the above mentions steps to read the input data, analyzing the data and giving the output of the analysis. The RUN statement at the end of each step finishes the execution of that step.
The complete SAS Program
Below given is the complete code for each of the above steps.

Output:


Where is SAS used?
Below given are some important SAS applications:
| Industry | Usage |
| Pharmaceutical | Statistical Analysis, Reporting |
| Telecom | ETL, Reporting, Data Mining, Forecasting |
| Financials | ETL, Reporting, Data Mining, Financial research |
| Predictive modeling | DBMarketing, Activity-Based Management |
| Healthcare | ETL, reporting, Data Mining |
SAS Vs. R
| SAS | R |
| SAS is commercial software, so it requires a financial investment. | R is open source software. Hence anyone can use it. |
| SAS is an easiest analytical tool to learn. Even people with limited knowledge of SQL can learn it quickly. | R requires you to write complicated and lengthy codes. |
| SAS is a highly preferred choice by big companies and is quite technically advanced & user-friendly. | R is fast developing software; however, you need to keep upgrading it. |
| SAS has good graphical support but does not offer any customization. | Graphical support of R tool is very poor. |
Advantages of SAS
- SAS has an easy syntax which can be learned without any type of programming knowledge
- Ability to handle a large database with ease
- SAS is a very comprehensible language which can easily be debugged
- Its "log" window clearly states the error which helps you to debug your code easily
- SAS helps you thoroughly test and analyze the algorithm
- SAS is completely secured so you can't extract without a license in the office
- Makes statistical computing easier for the non-programming users
- Handles large size database effectively.
Disadvantages of SAS
- Cost is high because individual or organization can't use it all applications without a proper license
- SAS is not open source so, algorithms used in SAS are not available for common use
- Text mining is a very troublesome and difficult process in SAS.
Summary
- SAS stands for Statistical Analysis Software which is used for Data analytics
- R and Python are two widely used alternative tools of SAS.
- SAS was developed by Jim Goodnight and John Shall in1970 at N.C. University
- SAS allows you to access raw data files & data in an external database of any kind
- SAS architecture is divided mainly of three parts 1)Client Tier 2) Middle Tier 3) Back tier
- To use SAS software you need to follow four steps which are: 1)Access Data, 2)Management 3) Analyze Data, 4) Presentation
- SAS Program consists of three basic steps: Data Step, Proc Step, and Output Step
- SAS data analytical tool is widely used in sectors like Pharmaceutical, Telecom, Financials, Predictive modeling, and Healthcare
- SAS is commercial software while R is open source software
- The biggest benefit of SAS tool is that it has an easy syntax that can be learned without any type of programming knowledge.
- One of the drawbacks of SAS is that it is not an open source tool. So, algorithms used in SAS procedures are not available for common use.
What is Data Analysis? Types, Process, Methods, Techniques
What is Data Analysis?
Data analysis is defined as a process of cleaning, transforming, and modeling data to discover useful information for business decision-making. Whenever we take any decision in our day-to-day life is by thinking about what happened last time or what will happen by choosing that particular decision. This is nothing but analyzing our past or future and making decisions based on it. For that, we gather memories of our past or dreams of our future. So that is nothing but data analysis. Now same thing analyst does for business purposes, is called Data Analysis.
In this tutorial, you will learn:
- What is Data Analysis?
- Why Data Analysis?
- Data Analysis Tools
- Types of Data Analysis: Techniques and Methods
- Data Analysis Process
Why Data Analysis?
To grow your business even to grow in your life, sometimes all you need to do is Analysis!
If your business is not growing, then you have to look back and acknowledge your mistakes and make a plan again without repeating those mistakes. And even if your business is growing, then you have to look forward to making the business to grow more. All you need to do is analyze your business data and business processes.
Data Analysis Tools
Data analysis tools make it easier for users to process and manipulate data, analyze the relationships and correlations between data sets, and it also helps to identify patterns and trends for interpretation. Here is a complete list of tools.
Types of Data Analysis: Techniques and Methods
There are several types of data analysis techniques that exist based on business and technology. The major types of data analysis are:
- Text Analysis
- Statistical Analysis
- Diagnostic Analysis
- Predictive Analysis
- Prescriptive Analysis
Text Analysis
Text Analysis is also referred to as Data Mining. It is a method to discover a pattern in large data sets using databases or data mining tools. It used to transform raw data into business information. Business Intelligence tools are present in the market which is used to take strategic business decisions. Overall it offers a way to extract and examine data and deriving patterns and finally interpretation of the data.
Statistical Analysis
Statistical Analysis shows "What happen?" by using past data in the form of dashboards. Statistical Analysis includes collection, Analysis, interpretation, presentation, and modeling of data. It analyses a set of data or a sample of data. There are two categories of this type of Analysis - Descriptive Analysis and Inferential Analysis.
Descriptive Analysis
analyses complete data or a sample of summarized numerical data. It shows mean and deviation for continuous data whereas percentage and frequency for categorical data.
Inferential Analysis
analyses sample from complete data. In this type of Analysis, you can find different conclusions from the same data by selecting different samples.
Diagnostic Analysis
Diagnostic Analysis shows "Why did it happen?" by finding the cause from the insight found in Statistical Analysis. This Analysis is useful to identify behavior patterns of data. If a new problem arrives in your business process, then you can look into this Analysis to find similar patterns of that problem. And it may have chances to use similar prescriptions for the new problems.
Predictive Analysis
Predictive Analysis shows "what is likely to happen" by using previous data. The simplest example is like if last year I bought two dresses based on my savings and if this year my salary is increasing double then I can buy four dresses. But of course it's not easy like this because you have to think about other circumstances like chances of prices of clothes is increased this year or maybe instead of dresses you want to buy a new bike, or you need to buy a house!
So here, this Analysis makes predictions about future outcomes based on current or past data. Forecasting is just an estimate. Its accuracy is based on how much detailed information you have and how much you dig in it.
Prescriptive Analysis
Prescriptive Analysis combines the insight from all previous Analysis to determine which action to take in a current problem or decision. Most data-driven companies are utilizing Prescriptive Analysis because predictive and descriptive Analysis are not enough to improve data performance. Based on current situations and problems, they analyze the data and make decisions.
Data Analysis Process
Data Analysis Process is nothing but gathering information by using proper application or tool which allows you to explore the data and find a pattern in it. Based on that, you can take decisions, or you can get ultimate conclusions.
Data Analysis consists of the following phases:
- Data Requirement Gathering
- Data Collection
- Data Cleaning
- Data Analysis
- Data Interpretation
- Data Visualization
Data Requirement Gathering
First of all, you have to think about why do you want to do this data analysis? All you need to find out the purpose or aim of doing the Analysis. You have to decide which type of data analysis you wanted to do! In this phase, you have to decide what to analyze and how to measure it, you have to understand why you are investigating and what measures you have to use to do this Analysis.
Data Collection
After requirement gathering, you will get a clear idea about what things you have to measure and what should be your findings. Now it's time to collect your data based on requirements. Once you collect your data, remember that the collected data must be processed or organized for Analysis. As you collected data from various sources, you must have to keep a log with a collection date and source of the data.
Data Cleaning
Now whatever data is collected may not be useful or irrelevant to your aim of Analysis, hence it should be cleaned. The data which is collected may contain duplicate records, white spaces or errors. The data should be cleaned and error free. This phase must be done before Analysis because based on data cleaning, your output of Analysis will be closer to your expected outcome.
Data Analysis
Once the data is collected, cleaned, and processed, it is ready for Analysis. As you manipulate data, you may find you have the exact information you need, or you might need to collect more data. During this phase, you can use data analysis tools and software which will help you to understand, interpret, and derive conclusions based on the requirements.
Data Interpretation
After analyzing your data, it's finally time to interpret your results. You can choose the way to express or communicate your data analysis either you can use simply in words or maybe a table or chart. Then use the results of your data analysis process to decide your best course of action.
Data Visualization
Data visualization is very common in your day to day life; they often appear in the form of charts and graphs. In other words, data shown graphically so that it will be easier for the human brain to understand and process it. Data visualization often used to discover unknown facts and trends. By observing relationships and comparing datasets, you can find a way to find out meaningful information.
Summary:
- Data analysis means a process of cleaning, transforming and modeling data to discover useful information for business decision-making
- Types of Data Analysis are Text, Statistical, Diagnostic, Predictive, Prescriptive Analysis
- Data Analysis consists of Data Requirement Gathering, Data Collection, Data Cleaning, Data Analysis, Data Interpretation, Data Visualization


0 Comments